Why Your Churn Rate Is Lying to You
churn and retention behaviour analytics funnel analytics lifecycle automation user behavior analytics user journey analytics
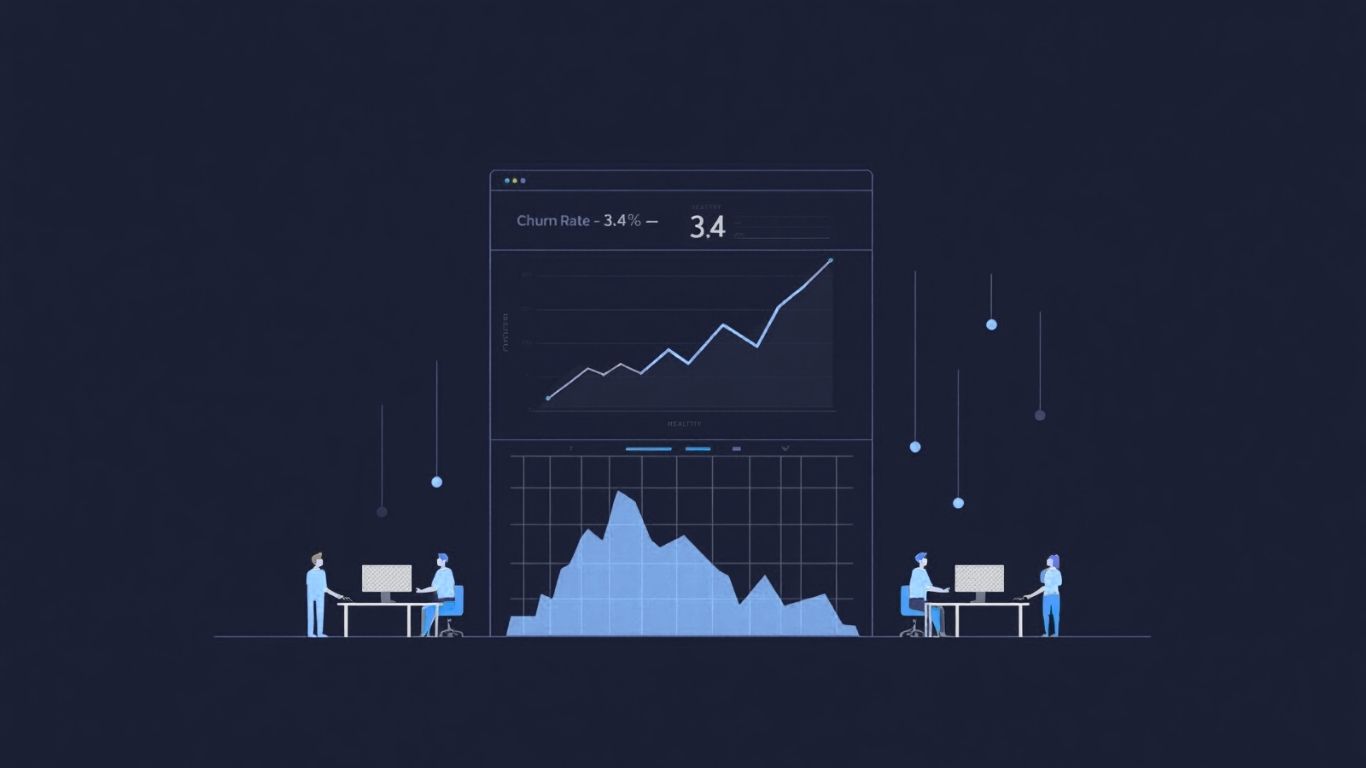
The number looks fine. Some churn, sure. Nothing alarming on the dashboard.
Then the quarterly cohort review arrives and something's off. An account you thought was healthy cancelled. Three others haven't logged in for weeks. The debrief conversation goes the same way it always goes — lots of theories, limited data, no clear picture of when it actually started going wrong.
This is the churn problem that doesn't show up in standard dashboards. The rate is accurate. The timing is the issue. By the time churn registers as a metric, you're already too late to do anything useful about it.
SaaS Churn Signals Are Accurate. The Timing Is Broken.
Churn rate tells you who left. It does not tell you when they decided to leave.
That distinction matters more than most teams recognise. In most SaaS products, the decision to leave happens weeks before the cancellation event. Sessions get shorter. A key feature goes untouched for two weeks, then three. Logins drop from daily to occasional. The account still shows as active. The dashboard looks fine.
"Most teams are managing churn as a historical event," says Ian Naylor, Founder of SaaSAnalytics.ai. "They're tracking what happened, not what's happening right now. Those are completely different problems — and they need completely different responses."
A historical view changes nothing in real time. You cannot retain a user who's already decided to go.
What Behavioral Signals Actually Look Like
Churn signals are product-specific. The patterns, though, hold across categories.
A user who ran reports every Tuesday stops for two weeks. A team account reaches month three without adding a single collaborator. An integration that got configured on day one sits completely idle. None of these fire a default alert. None appear on a standard churn dashboard. Without event tracking and threshold monitoring in place, they disappear into the data and you find out about them during a post-mortem that changes nothing.
Becky Halls, Strategist at SaaSAnalytics.ai, has seen this pattern across a lot of SaaS products: "The behavioral signals for churn are obvious in hindsight — they're right there in the session data. The question is whether you built a system that surfaces them at the time, when you can still do something about it."
Obvious in hindsight isn't actionable. Actionable is the part that matters.
The NPS Problem
NPS surveys appear in most SaaS retention playbooks. They have real limitations.
First: NPS captures opinion. Behavior captures reality. A user can score your product an eight and be logging in 40% less than they were three months ago. Opinion and usage diverge regularly — and when they do, usage is the one telling the truth.
Second, there is a sampling problem. Survey responses skew toward engaged users - people who bother to reply. The users drifting toward exit are often too disengaged to open the email. You're measuring the people most likely to stay and calling it a retention signal.
NPS has a role. Useful data, genuine signal for some things. The mistake is treating it as sufficient when what you actually need is behavioral visibility — something that doesn't depend on users raising their hand to tell you something is wrong.
The Cohort Blindspot
Aggregate churn rates hide a lot of uncomfortable specificity.
4.5% monthly churn looks identical whether it's evenly distributed across your entire customer base, or one specific acquisition cohort churning at 15% while the rest hold steady. Completely different problems. One needs a product fix; the other needs a closer look at which channel or onboarding path is broken.
Looking only at the top-line number, you genuinely cannot tell the difference.
Cohort analysis - cut by signup date, acquisition channel, initial behaviour, plan type - is where retention signal actually lives. It shows which groups are healthy, which are drifting, and which product changes genuinely improved retention versus which just seemed like they should have.
SaaS teams using cohort-based behavioral analytics to drive retention decisions see churn reductions of up to 40% compared to teams working from aggregate metrics alone. Not a marginal improvement. A meaningful operational shift.
Lincoln Murphy, customer success strategist and author of Customer Success, has been writing about this for years. His position is clear: "The seeds of churn are planted early." By the time users cancel, the decision was already made in the behavior data - weeks before it showed up anywhere on your dashboard.
What You Actually Need
Three things, not fifteen.
First, event tracking that captures the specific actions correlating with long-term retention in your product. Not every click. The things that actually predict whether someone stays or leaves.
Second, automated alerts when user behavior deviates from healthy patterns. Not a weekly review cycle - something that flags issues in close to real time, while there's still someone to reach.
Third, a response mechanism. An in-app message, a triggered email, an AI support prompt, whatever makes sense for your product. The alert needs to connect to an action, not just a dashboard entry someone might check next Monday.
Most SaaS teams have pieces of this scattered across different tools that don't communicate with each other. That's precisely what makes early churn signals so hard to act on. You can read more about how fragmented analytics stacks create these gaps in Stop Running Three Tools Where One Will Do.
And if the picture of your activation funnel isn't clear, which is usually where the churn story starts, The Activation Gap is worth reading alongside this.
SaaSAnalytics.ai gives you behavioral tracking, automated triggers, and AI support that responds to real user signals from a single JavaScript snippet. No three-tool stack. No fragmented data. One source of truth, and a system that acts on it while you still can.
FAQ
Is churn rate a useless metric? Not useless — just late. Use it to measure overall health and track direction over time. Do not rely on it to catch individual accounts at risk. Behavioral signals are earlier and more specific. Both have a role; just know which one you're using and what it can and can't tell you.
How early can you realistically detect churn signals? In most SaaS products, meaningful behavioral divergence shows up two to four weeks before cancellation or non-renewal. That's a real window. Enough time to intervene — and often enough to change the outcome if you have the right automation in place.
What events should I actually track? The actions most correlated with long-term retention in your product. Run a simple cohort comparison: users who completed action X in their first 30 days versus those who didn't. Large retention differences point you toward your most important signals. Track those. Not everything.
Can you detect churn risk without a data science team? Yes. Modern behavioral analytics platforms handle the pattern detection. You define what "healthy" looks like in your product and set thresholds; the system flags when users deviate. No need to build prediction models from scratch.
My churn rate is within industry benchmarks — do I still have a problem? Median monthly churn for B2B SaaS in 2026 sits around 3.5%. If you're below that across all cohorts, you're in reasonable shape. But look at your best cohorts versus your worst — the gap between them tells you how much improvement is realistically on the table. Benchmark average is a floor, not a ceiling.
How does SaaSAnalytics.ai help with churn signals specifically? Behavioral event tracking and automated triggers based on user patterns are core features. You set the thresholds that matter for your product; the platform alerts and responds when users show early churn signals. The goal is action at the right moment — not just information stored somewhere after the fact.