The Modern SaaS Analytics Stack: Why So Many Tools - and Why It Still Feels Incomplete
analytics tools analytics platform product analytics product analytics tools real-time analytics SaaS analytics saas founders SaaS growth saas metrics data analytics conversion analytics user journey analytics

If you map the typical SaaS stack today, it looks impressive.
Website analytics tracking traffic.
Product analytics tracking behaviour.
A CDP routing events.
Marketing tools pulling attribution data.
BI dashboards visualising metrics.
On paper, everything is measured.
And yet, in practice, many SaaS founders still feel uncertain.
They have dashboards. They have reports. They have cohorts and funnels. But when churn ticks up or growth slows, they’re still asking the same question:
What’s actually happening?
This article ties together the modern analytics stack — from website tools like Google Analytics and Plausible, to product platforms like Mixpanel, Amplitude, and PostHog, to infrastructure layers like Segment — and explains why even with all of that, something can still feel missing.
Because the issue usually isn’t tracking.
It’s translation.
Layer 1: Website Analytics - Who Came?
Most SaaS journeys begin with website analytics.
Tools like GA4, Matomo, Plausible, and Umami answer fundamental marketing questions:
Where did traffic come from?
Which pages convert best?
What campaigns perform well?
Are visits increasing?
For early-stage SaaS, this is more than enough. If you don’t understand acquisition, nothing else matters.
But website analytics live at the top of the funnel. They describe arrival, not experience.
And SaaS success doesn’t hinge on who came.
It hinges on who stayed.
Layer 2: Product Analytics - What Did They Do?
As SaaS products mature, founders inevitably realise that pageviews don’t explain retention.
This is where product analytics platforms enter.
Mixpanel, Amplitude, and PostHog shift the lens inward. They track events inside the product. They allow you to build funnels, cohorts, retention curves, and behavioural paths.
You can ask questions like:
Which features correlate with retention?
Where do users drop off in onboarding?
How do cohorts behave over time?
Does Feature A increase engagement?
This layer is a huge leap forward from website analytics. It surfaces patterns that would otherwise remain invisible.
But it also introduces complexity.
Event taxonomies must be designed.
Cohorts must be interpreted.
Funnel definitions must be maintained.
Two intelligent people can look at the same dashboard and draw different conclusions.
Product analytics answers “what did they do?”
It doesn’t automatically answer “what does that mean for our SaaS?”
Layer 3: Data Infrastructure - Where Does It All Go?
As stacks expand, fragmentation becomes obvious.
Marketing tools track one thing. Product analytics track another. CRM systems track something else entirely.
This is where Segment enters.
Segment centralises event tracking and routes data across tools. Instead of instrumenting five systems, you instrument one and distribute the data downstream.
For growing SaaS companies, especially those with engineering resources, this can be transformative. Data definitions become consistent. Integrations simplify. Warehousing becomes feasible.
But infrastructure doesn’t equal insight.
Segment makes data cleaner.
It doesn’t make it clearer.
Why It Still Feels Incomplete
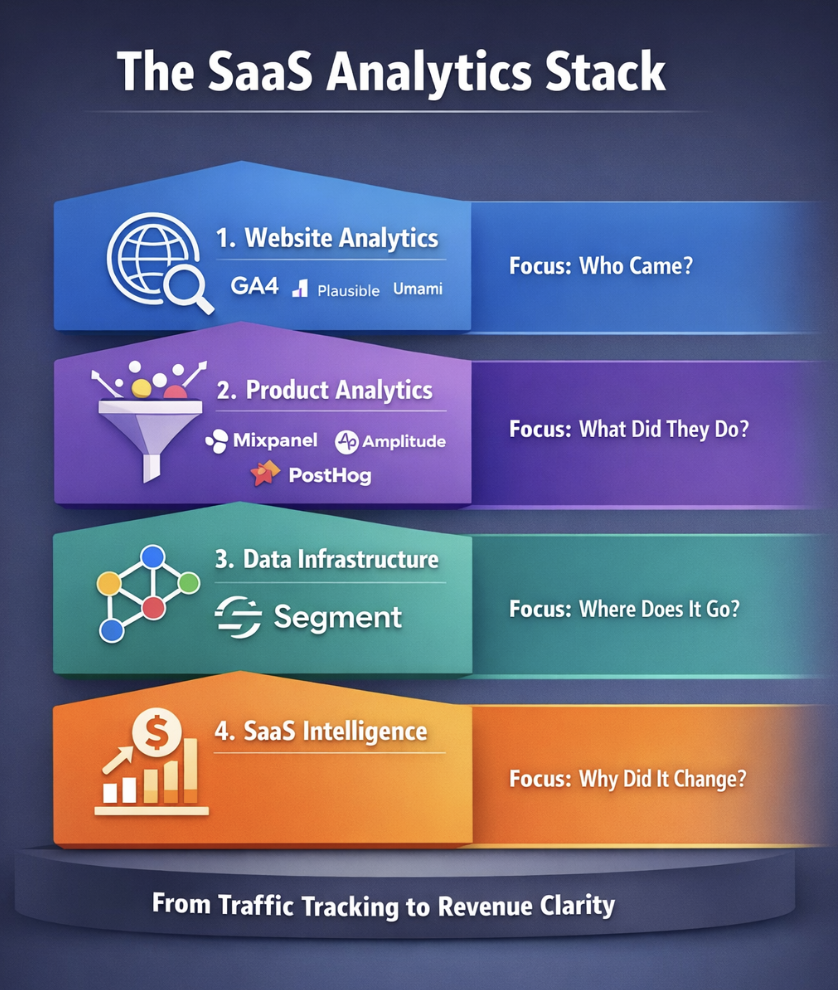
When you step back, the modern stack looks like this:
Website analytics → acquisition clarity
Product analytics → behavioural clarity
CDP → data routing clarity
And yet, many founders still struggle with:
Churn unpredictability
Retention instability
Revenue volatility
Team misalignment on metrics
Why?
Because each layer solves a different slice of the puzzle.
No layer inherently connects behaviour to subscription economics in a SaaS-native way.
You can build that logic across tools. But it usually requires:
Engineering involvement
BI dashboards
Manual modelling
Cross-tool stitching
For enterprise teams, that’s normal.
For founder-led SaaS companies, it’s friction.
The Missing Layer: SaaS-Native Intelligence
This is where SaaSAnalytics was designed to sit.
Not as a replacement for website analytics.
Not as a direct competitor to Mixpanel or Amplitude.
Not as a CDP alternative.
But as a SaaS-native interpretation layer.
Instead of starting with events and asking “what can we explore?”, SaaSAnalytics starts with SaaS questions:
Is activation strong?
Is retention stabilising?
Are churn signals emerging?
Is revenue aligned with behaviour?
Where is friction increasing?
It assumes subscription logic from the beginning. It treats revenue and behaviour as interconnected, not separate streams.
It reduces the translation layer between data and decision.
The Evolution of a SaaS Stack
Most SaaS stacks evolve like this:
Stage 1
Website analytics. Focus on acquisition.
Stage 2
Product analytics. Focus on engagement.
Stage 3
Data infrastructure. Focus on consistency.
Stage 4
Business clarity. Focus on retention and revenue alignment.
The first three stages are common. The fourth is where confusion either compounds or clarity emerges.
SaaSAnalytics sits at Stage 4.
It doesn’t replace the earlier layers. It interprets them through a SaaS lens.
Explore Each Layer in Detail
If you’re building or scaling a SaaS product, chances are you’re not choosing between one analytics tool and another in isolation. You’re trying to understand how the entire stack fits together - and where the friction really is.
Below is a deeper breakdown of each layer in the modern SaaS analytics stack, with focused comparisons that unpack where each category works well and where its natural limits appear.
1. Website Analytics Layer
Understanding who came - and why that’s only the beginning.
Website analytics tools are often the starting point for any SaaS team. They give you clarity on traffic, referrals, and campaign performance. For early-stage products, that’s exactly what you need.
But once activation and retention become the real levers of growth, traffic data alone stops answering the important questions.
If you’re evaluating website-first analytics tools, explore:
GA4 for SaaS – Where it excels at marketing attribution, and where product insight requires more configuration than most founders expect.
Matomo for SaaS – A privacy-first alternative to Google Analytics, and how it fits into a growing SaaS stack.
Plausible for SaaS – Clean, lightweight analytics and where simplicity eventually meets its ceiling.
Umami for SaaS – Open-source website analytics and what happens when SaaS complexity increases.
These articles unpack the shift from “who visited?” to “what happened next?”
2. Product Analytics Layer
Understanding what users did - and what that behaviour really means.
When SaaS teams outgrow website analytics, they often move into product analytics platforms. These tools track events inside your product, build behavioural funnels, and allow deeper exploration of user journeys.
This is a critical evolution. But it can also introduce complexity. Behavioural depth doesn’t automatically translate into business clarity.
If you’re exploring product analytics platforms, take a closer look at:
Mixpanel for SaaS – Behaviour analytics versus SaaS-native business intelligence.
Amplitude for SaaS – Deep product exploration and where operational clarity fits in.
PostHog for SaaS – Open-source experimentation and how it compares to SaaS-focused insight.
These comparisons focus on the difference between analysing behaviour and understanding how that behaviour affects retention and revenue.
3. Data Infrastructure Layer
Understanding where your data goes - and why plumbing isn’t the same as insight.
As stacks grow, fragmentation becomes a problem. Events fire in one tool. Revenue sits in another. CRM data lives somewhere else. That’s when Customer Data Platforms enter the conversation.
Infrastructure tools help standardise and route data, but they don’t interpret it for you.
If you’re evaluating this layer, explore:
Segment for SaaS – Data centralisation versus SaaS-native intelligence.
This layer is about consistency and integration. But it doesn’t replace the need for clarity.
Bringing It All Together
Each layer in the SaaS analytics stack solves a different problem:
Website analytics explains acquisition.
Product analytics explains behaviour.
CDPs explain integration.
SaaS-native intelligence explains business health.
If you’re feeling overwhelmed by tools but underwhelmed by clarity, it’s usually not because you’re missing data. It’s because the layers aren’t aligned with the stage your SaaS is in.
Understanding where each tool fits (and where it doesn’t) is the first step toward building a stack that actually supports growth instead of complicating it.
Final Thought
The modern SaaS analytics stack is powerful. But power without alignment creates complexity.
Website analytics tell you who came.
Product analytics tell you what they did.
CDPs move the data around.
SaaS growth ultimately depends on understanding why behaviour changes revenue - and acting on it quickly.
That’s not a tooling problem, It’s a layer problem.
And once you see it that way, the stack makes a lot more sense.